Interactive rounded Corners on SVG Polygons with d3.js
- Data visualisation
- D3.js

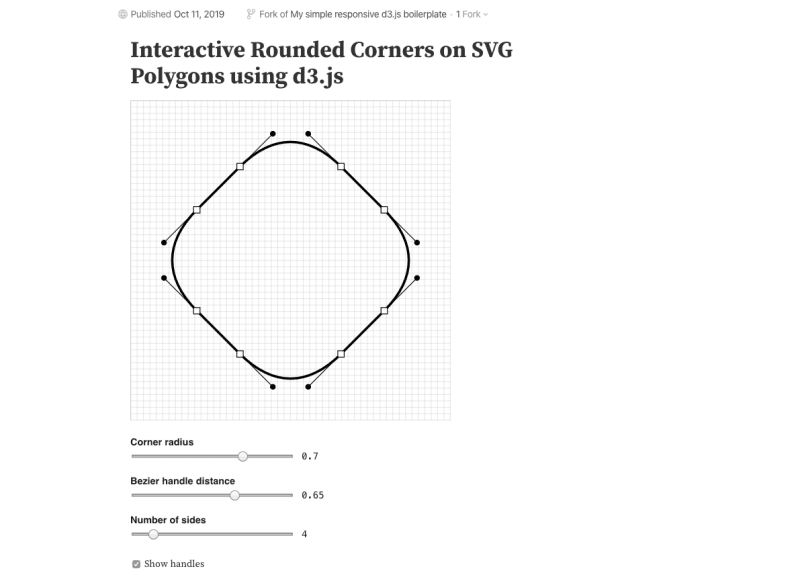
As an attempt to learn how the Observable platform works I created a tool/visualisation for creating rounded corners for SVG polygons using d3.js. Observable is a great platform for creating, prototyping and sharing visualisations, and it makes it easy to explore and fork other people’s work.
See the interactive visualisation at my Observable page.

This could potentially be made into a d3 plugin, but I haven’t gotten that far (yet).
The visualisation lets you play with different shapes (number of sides) and corner radii and see the results on screen.
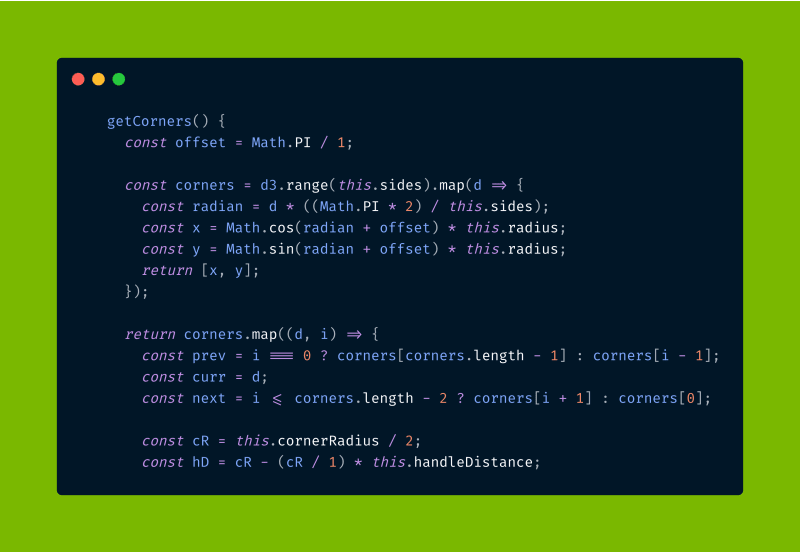
There’s a bit of trigonometry required to calculate the positions for the SVG path’s d attribute for each of corners’ bezier curve coordinates which you should be able to explore on the Observable page.